
Climate Data Visualization
Climate Change
A scrollable overview of the project visualizations, with each section linking to a deeper page for context, impacts, and possible responses.
Start Exploring
Loading temperature data...
Loading CO2 data...
Antarctic Ozone Hole
2000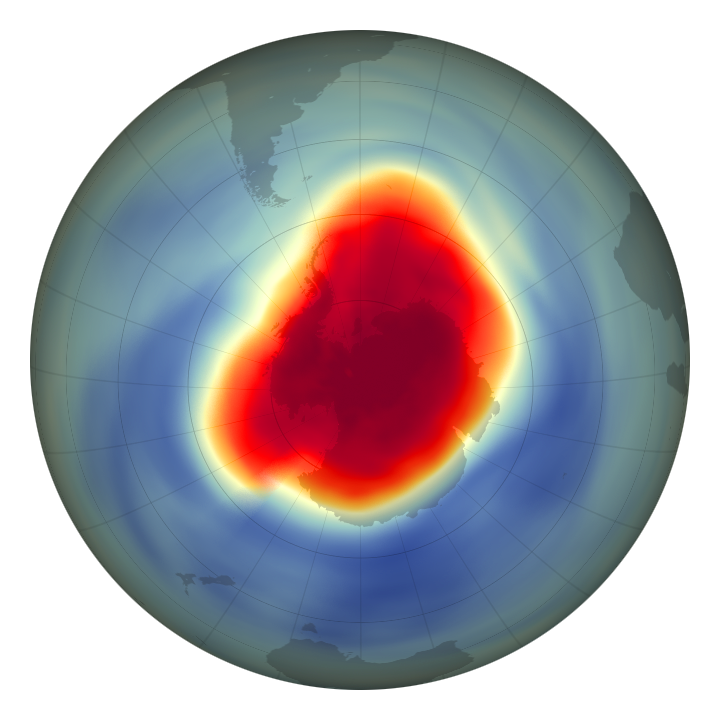
CFC Levels by Hemisphere
Atmospheric concentration in parts per trillion, 1979-2019.
Loading CFC data...
Loading electricity data...
Individual
Reduce energy use, choose low-carbon transport, waste less, and support cleaner products.
Community
Support local resilience planning, clean energy projects, and public climate education.
Systems
Back policies and investments that reduce emissions and protect carbon-storing ecosystems.